104 Repositories
JavaScript bar-charts Libraries
Userscript that adds a search bar to tabnews.com.br

TabBusca Userscript that adds a search bar to tabnews.com.br Download This is a userscript. To use it you'll first need one of the following browser e
A server-side-rendered charting library for Fresh
fresh_charts A server side rendered charting library for Fresh based on Chart.js. Usage There are two main ways to render a chart. There is the JSX/TS
🟢 Music player app with a modern homepage, fully-fledged music player, search, lyrics, song exploration features, search, popular music around you, worldwide top charts, and much more.
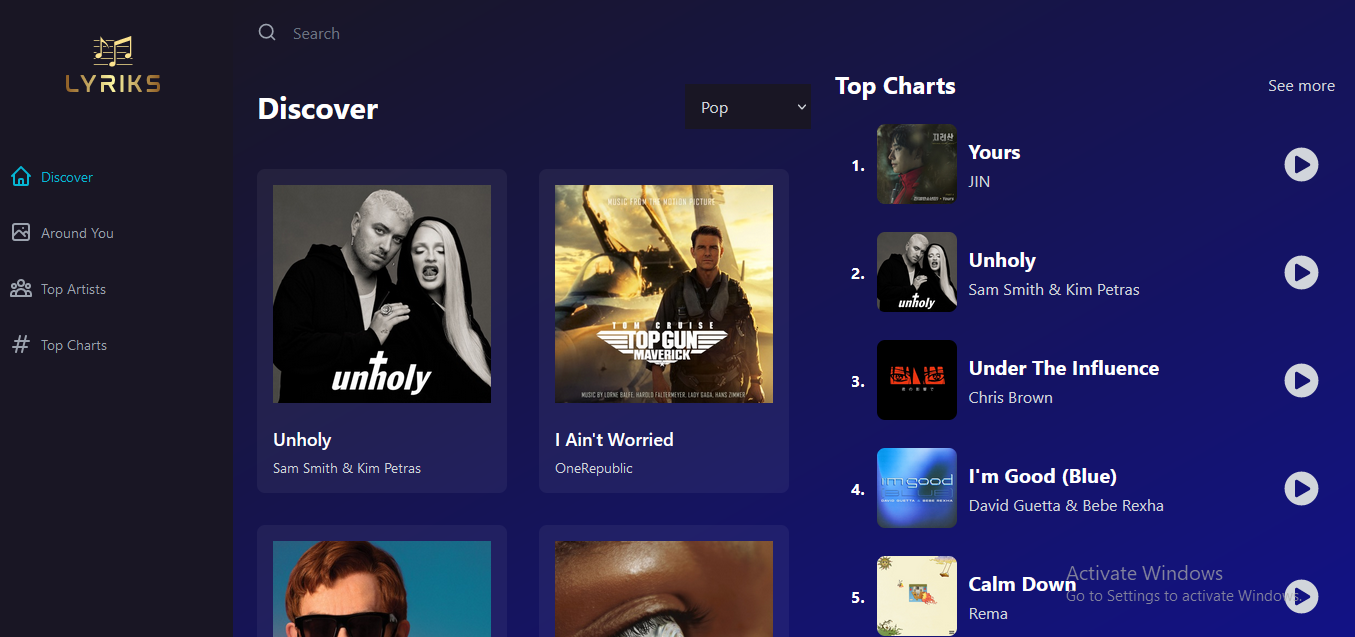
Music-player-app see the project here. 1. Key Features 2. Technologies I've used Key Features: 🟢 Fully responsive clean UI. 🟢 Entirely mobile respo
Twitter like notify bar
jQuery Notify bar Please visit the project page for feedback and other details. Simple plugin (basically it's not a plugin, but widget) to show notify
jQuery plugin to show a tabs bar for navigation. The tabs can be defined once, and shared across multiple HTML pages.

jquery.simpletabs v1.2.3 The jquery.simpletabs plugin shows a tabs bar for navigation. The tabs can be defined once, and shared across multiple HTML p
Responsive Dropdown Menu Bar
Responsive Dropdown Menu Watch it on youtube Responsive Dropdown Menu Beautiful and clean responsive navigation bar includes a beautiful drop-down sid
Super lighweight, pure JavaScript page load progress bar

Nanobar Super lighweight, pure JavaScript page load progress bar Status View Preview Table of contents Status Quick Start What's included Bugs and fea
windows-style title bar component for Electron

electron-windows-titlebar windows-style title bar component for Electron Demo Contributors xudafeng This project follows the git-contributor spec, aut
Statistics plugin for RemNote that will give you some helpful numbers, charts and heatmap for your knowledge base.
RemNote statistics plugin Features This plugin will give you the following statistics: Retention rate Number of cards due in future Type of buttons yo
Slim progress bars for anywhere you want to use
qier-progress is a progress bar. It can be used for some watting time like jump links, request data, and load or upload files and images to give us feedback and reduce our anxiety. Also if you have used nprogress, then you must know what I am talking about ~
Using ASP.NET Core, SignalR, and ChartJs to create real-time updating charts

Real-time Charts with ASP.NET Core, SignalR, and Chart.js This project shows how to update a real-time chart in your web browser using technologies li
Open source CSS framework for data visualization.
Charts.css Charts.css is an open source CSS framework for data visualization. Visualization help end-users understand data. Charts.css help frontend d
A Javascript library to export svg charts from the DOM and download them as an SVG file, PDF, or raster image (JPEG, PNG) format. Can be done all in client-side.
svg-exportJS An easy-to-use client-side Javascript library to export SVG graphics from web pages and download them as an SVG file, PDF, or raster imag
jQuery plugin for a Notification Bar
jquery.peekABar A jQuery plugin for a notification bar with customization options. Important Note We have stopped supporting bower as a package manage
A simple script for pure javascript charts.
MK Charts A simple pure Javascript for displaying circle charts. Demo: https://mkirschen.de/mk-scripts/mk-charts/ Circle charts To insert a chart all
jQuery based scrolling Bar, for PC and Smartphones (touch events). It is modern slim, easy to integrate, easy to use. Tested on Firefox/Chrome/Maxthon/iPhone/Android. Very light 7ko min.js and 1Ko min.css.
Nice-Scrollbar Responsive jQuery based scrolling Bar, for PC and Smartphones (touch events). It is modern slim, easy to integrate, easy to use. Tested
It's a tiny freeware library on TypeScript to sinhronize page scrolling and navigation meny-bar.
Scroll progress (dual-side-scroll) v1.2.3 Assignment This tiny plugin is designed to show the progress of the page scrolling interactively. There are
ln-charts parses the output of bos accounting commands into various charts for your Lightning Node.

ln-charts ln-charts parses the output of bos accounting commands into various charts for your Lightning Node. It runs on Angular, JS, HTML, CSS, ngx-c
📱📈An elegant, interactive and flexible charting library for mobile.

F2,一个专注于移动,开箱即用的可视化解决方案,完美支持 H5 环境同时兼容多种环境(node, 小程序,weex)。完备的图形语法理论,满足你的各种可视化需求。专业的移动设计指引为你带来最佳的移动端图表体验。英文 README 在此衷心感谢《The Grammar of Graphics》的作者
Simple yet flexible JavaScript charting for designers & developers
Simple yet flexible JavaScript charting for designers & developers Documentation All the links point to the new version 3 of the lib. Introduction Get
D3 (or D3.js) is a JavaScript library for visualizing data using web standards
D3 (or D3.js) is a JavaScript library for visualizing data using web standards. D3 helps you bring data to life using SVG, Canvas and HTML. D3 combines powerful visualization and interaction techniques with a data-driven approach to DOM manipulation, giving you the full capabilities of modern browsers and the freedom to design the right visual interface for your data.
Hourly weather card for Home Assistant. Visualize upcoming weather conditions as a colored horizontal bar.

Hourly Weather Card by @decompil3d An hourly weather card for Home Assistant. Visualize upcoming weather conditions as a colored horizontal bar. Can y
⛴ Manage Docker containers from the menu bar.
Captain INTRODUCTION Manage Docker containers. Instantly from the menu bar. See which containers are running and which have stopped. Conveniently star
A progress bar plugin for tasks in Obsidian.

Obsidian Task Progress Bar A plugin for showing task progress bar near the tasks bullet or headings. Only works in Live Preview mode in Obsidian. Sett
A progress bar plugin for Vite.

vite-plugin-progress Display with progress bar when building 📦 Install npm i vite-plugin-progress -D # yarn yarn add vite-plugin-progress -D # pn
An open-source visualization library specialized for authoring charts that facilitate data storytelling with a high-level action-driven grammar.

Narrative Chart Introduction Narrative Chart is an open-source visualization library specialized for authoring charts that facilitate data storytellin
Spotlight-like search bar for spotify

Spicetify power bar Spotlight-like quick search bar to navigate to tracks, albums, artists and playlists. Table of contents Installation Usage Setting
A rhythm game played in your browser's address bar
URLX URLX is a rhythm game played in your browser's address bar. (no it does not stand for anything it's just the best name i could think of) Hit arro
Vanila JS Sparklines library inspired by peity.js

Peity Vanilla JS Converts an element's content into a svg mini pie donut line or bar chart and is compatible with any browser that supports svg: C
Elections in Russia, Saint Petersburg, 2021: results, turnout, and commission data. With image charts and brief introduction to election fraud methods used.

2021 Elections in Saint Petersburg, Russia 🇷🇺 Переключиться на русский 📈 Jump to charts 🤖 Telegram bot In Russia, Saint Petersburg from 17th to 19
CLI Progress Bar implemented in NodeJS to track Time, ETA and Steps for any long running jobs in any loops in JS, NodeJS code

NodeJS-ProgressBar CLI Progress Bar for NodeJS and JavaScript to track Time, ETA and Steps for any long running jobs in any loops in JS, NodeJS code D
🎧 Get json type billboard hot 100 chart
Billboard json Get json type billboard hot 100 chart, Data update every day !! Url Hot 100 : https://raw.githubusercontent.com/KoreanThinker/billboard
⌨️ Visualize keyboard history for osu! in bar form

bar-overlay-for-osu Visualize keyboard history for osu! Example Vertical Horizontal Features Customizable: keys, colors, speed, spacing, etc. Receives
A web application to 🔍inspect your GitHub Profile Stats📊 in a lucid way. Visualization made easy with Charts💡🚀

know-your-gitstats A web application to 🔍 inspect your GitHub Profile Stats 📊 in a lucid way. Visualization made easy with Charts 💡 🚀 . ✅ Features
TrackIt - Single Page Application that helps the user track their habits.

TrackIt - Single Page Application that helps the user track their habits. Implemented with JavaScript/React and an API server which enables the user to sign-in or sign-up in the app.
NG Bootstrap - Angular powered Bootstrap widgets
NG Bootstrap - Angular powered Bootstrap widgets Angular widgets built from the ground up using only Bootstrap 4 CSS with APIs designed for the Angula
Synchro Charts is a front-end component library that provides a collection of components to visualize time-series data.
Synchro Charts Synchro Charts is a front-end component library that provides a collection of components to visualize time-series data. You can learn m
Bar Funnel Chart extension for Chart.js

Chart.BarFunnel.js Provides a Bar Funnel Chart for use with Chart.js Documentation To create a Bar Funnel Chart, include Chart.BarFunnel.js after Char
Chart.js Box Plots and Violin Plot Charts

Chart.js Box and Violin Plot Chart.js module for charting box and violin plots. This is a maintained fork of @datavisyn/chartjs-chart-box-and-violin-p
Chart.js Graph-like Charts (tree, force directed)

Chart.js Graphs Chart.js module for charting graphs. Adding new chart types: graph, forceDirectedGraph, dendogram, and tree. Works great with https://
Chart.js module for creating matrix charts

chartjs-chart-matrix Chart.js v3.0.0 module for creating matrix charts Example Documentation You can find documentation for chartjs-chart-treemap at h
Chart.js module for creating treemap charts

chartjs-chart-treemap Chart.js v3.6.0 module for creating treemap charts. Implementation for Chart.js v2 is in 2.x branch Documentation You can find d
Chart.js scale for hierarchical tree-like data structure
Chart.js Hierarchical Scale Plugin Chart.js module for adding a new categorical scale which mimics a hierarchical tree. Related Plugins Check out also
Chart.js plugin to create charts with a hand-drawn, sketchy, appearance
chartjs-plugin-rough Chart.js plugin to create charts with a hand-drawn, sketchy, appearance Version 0.2 requires Chart.js 2.7.0 or later, and Rough.j
This plugin for Chart.js that makes your bar chart to 100% stacked bar chart.

chartjs-plugin-stacked100 This plugin for Chart.js that makes your bar chart to 100% stacked bar chart. Requires Chart.js 3.x. Demo: https://y-takey.g
Makes waterfall charts easy with chartjs-2
Installation npm install --save chartjs-plugin-waterfall Here's what it looks like: Usage Just import the plugin and add it to any chart that you want
A simple ember component for adding Charts
Ember Chart This Ember CLI addon is a simple wrapper for ChartJS (v2.9). Compatibility Ember.js v3.12 or above Ember CLI v2.13 or above Node.js v10 or
Beautiful charts for Angular based on Chart.js
ng2-charts slack Beautiful charts for Angular based on Chart.js Usage & Demo Samples using ng2-charts https://valor-software.com/ng2-charts/ Installat
React components for Chart.js, the most popular charting library
react-chartjs-2 React components for Chart.js, the most popular charting library. Supports Chart.js v3 and v2. Quickstart • Docs • Slack • Stack Overf
J2CL and GWT Charts library based on CHART.JS

Charba - J2CL and GWT Charts library based on CHART.JS What's Charba GWT Web toolkit doesn't have charting library available out of the box. There are
Django Class Based Views to generate Ajax charts js parameters.
Django Chartjs Django Chartjs lets you manage charts in your Django application. This is compatible with Chart.js and Highcharts JS libraries. Using a
Simple package to facilitate and automate the use of charts in Laravel 5.x using Chartjs v2 library
laravel-chartjs - Chart.js v2 wrapper for Laravel 5.x Simple package to facilitate and automate the use of charts in Laravel 5.x using the Chart.js v2
Beautiful and interactive javascript charts for Java-based web applications.
Wicked Charts Beautiful and interactive JavaScript charts for Java-based web applications. Check out the Changelog Check out the Feature Overview with
TChart.js - simple and configurable Bar and Line Chart library in Javascript

TChart.js Simple and configurable Bar and Line Chart library in Javascript Description TChart.js is a canvas-based simple Javascript Bar and Line Char
Mosha-vue-toastify - A light weight and fun Vue 3 toast or notification or snack bar or however you wanna call it library.

Mosha Vue Toastify A lightweight and fun Vue 3 toast or notification or snack bar or however you wanna call it library. English | 简体中文 Talk is cheap,
Vue-crypto-dashboard - Cryptocurrency Dashboard made with Vue

Vue Crypto Dashboard A Cryptocurrency Dashboard build with Vue JS, PWA enabled, Binance Websocket API for realtime price, amChart for displaying histo
RocketTrades - Discord Stocks and Charts bot. Written for the RocketTrades Discord bot.
Rocket Trades RocketTrades, Discord Charts and Stocks bot. MORE DETAILS AND UPDATES TO COME SOON Getting started • Installation • Configuration • Inte
Custom touch bar or digital macropad app for GNU/Linux 🐧 using an Android device 📱

🐗 Boar 🎛️ Custom touch bar or digital macropad app for GNU/Linux 🐧 using an Android device 📱 Those apps allow creating a keyboard with custom keys
A simple react js onscroll sticky Nav bar library

react-js-stickynav A simple react js nav bar onscroll Intro Install npm install --save react-js-stickynav Usage length = navigation length , which is
Free Bootstrap 5 Admin and Dashboard Template that comes with all essential dashboard components, elements, charts, graph and application pages. Download now for free and use with personal or commercial projects.
PlainAdmin - Free Bootstrap 5 Dashboard Template PlainAdmin is a free and open-source Bootstrap 5 admin and dashboard template that comes with - all e
Multi Upload with Progress Bar in Vanilla JS

js-progress-bar-multi-upload Multi Upload with Progress Bar in Vanilla JS Youtube dersinde birlikte hazırladığımız çoklu progress barlı javascript upl
Create PowerPoint presentations with a powerful, concise JavaScript API.
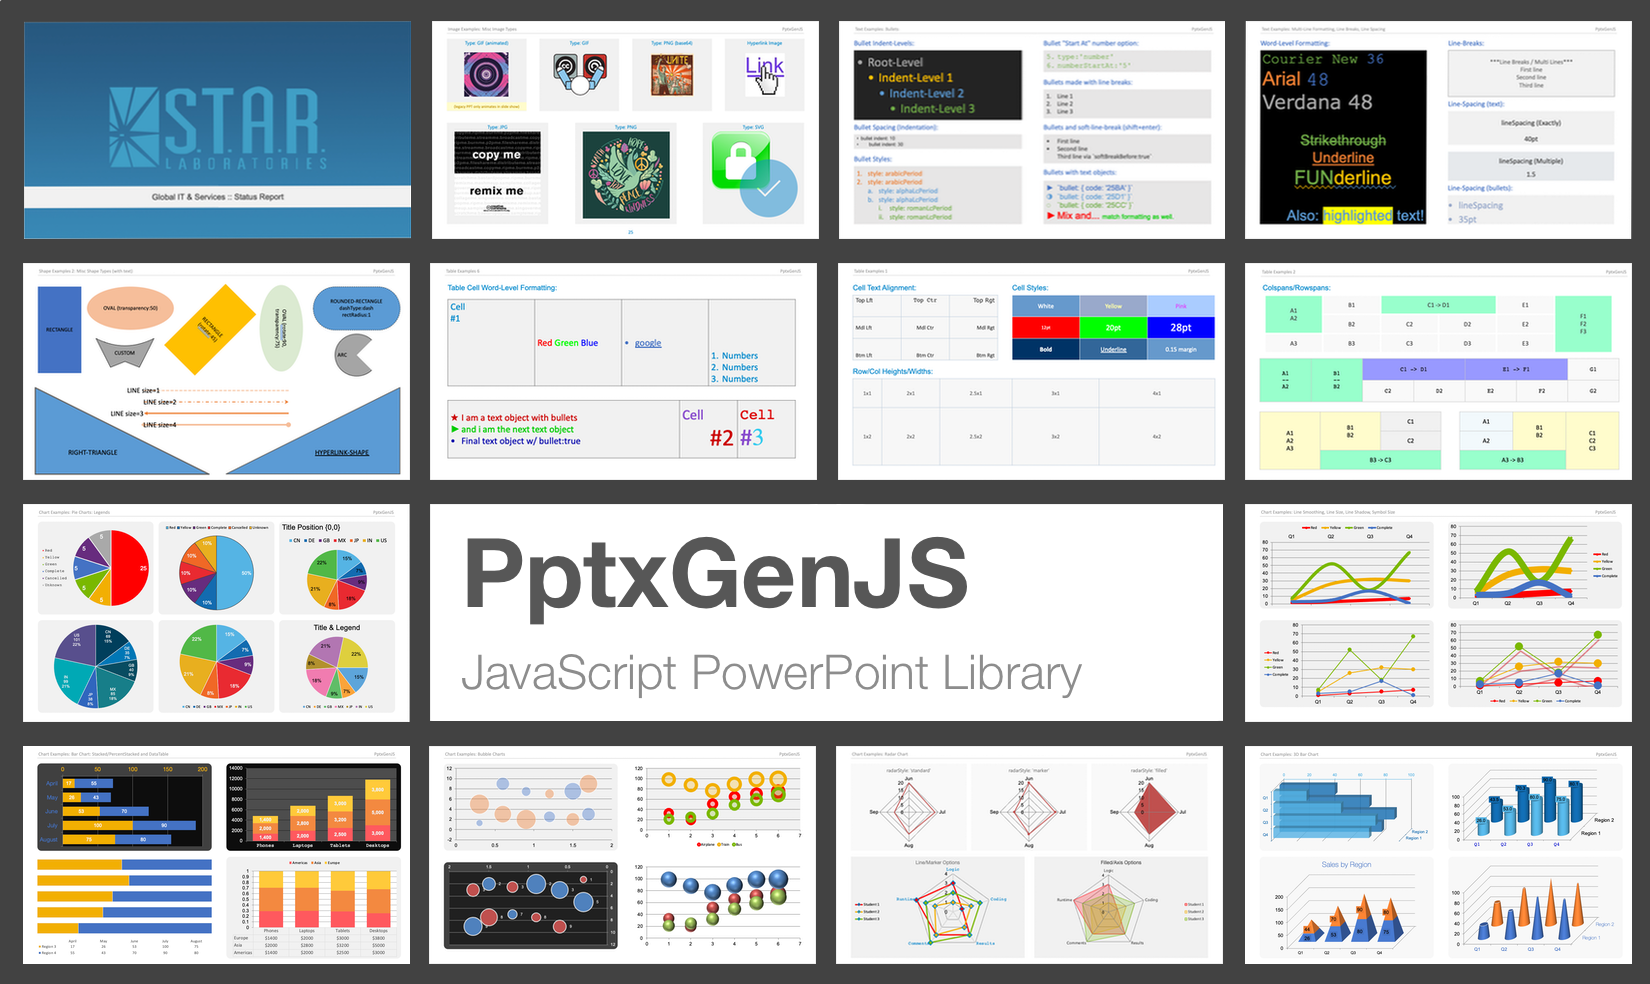
This library creates Open Office XML (OOXML) Presentations which are compatible with Microsoft PowerPoint, Apple Keynote, and other applications.
JQuery plugin for creating charts

JQuery Linechart JQuery plugin for building a linechart. Chart ruler completely on HTML/CSS/JS. Bar chart, calendar view visualisation. Diagram, graph
📈 A small, fast chart for time series, lines, areas, ohlc & bars

📈 μPlot A small (~35 KB min), fast chart for time series, lines, areas, ohlc & bars (MIT Licensed) Introduction μPlot is a fast, memory-efficient Can
Smoothie Charts: smooooooth JavaScript charts for realtime streaming data
Smoothie Charts is a really small charting library designed for live streaming data. I built it to reduce the headaches I was getting from watching ch
Chart image and QR code web API
QuickChart QuickChart is a service that generates images of charts from a URL. Because these charts are simple images, they are very easy to embed in
Emprise Javascript Charts
EJSChart 100% Powerful, Clean & Functional Javascript Charts Whether at home, a medium sized or enterprise venture, EJSCharts will seamlessly help you
Create beautiful JavaScript charts with one line of Ruby
Chartkick Create beautiful JavaScript charts with one line of Ruby. No more fighting with charting libraries! See it in action Chartkick 4.0 was recen
📊 Interactive JavaScript Charts built on SVG
A modern JavaScript charting library to build interactive charts and visualizations with simple API. Our Partner ApexCharts is now a partner of Fusion
Open-source JavaScript charting library behind Plotly and Dash
Plotly.js is a standalone Javascript data visualization library, and it also powers the Python and R modules named plotly in those respective ecosyste
Apache ECharts is a powerful, interactive charting and data visualization library for browser
Apache ECharts Apache ECharts is a free, powerful charting and visualization library offering an easy way of adding intuitive, interactive, and highly
Compose complex, data-driven visualizations from reusable charts and components with d3
d3.compose Compose rich, data-bound charts from charts (like Lines and Bars) and components (like Axis, Title, and Legend) with d3 and d3.chart. Advan
CSS loading animations with minimal effort!
Whirl CSS loading animations with minimal effort! whirl is a curation of CSS loading animations(whirls! 😅 ). It started as a drop in CSS file to get
Creates a button that turns into a progress bar with a elastic effect. Based on the Dribbble shot "Download" by xjw
Elastic Progress Creates a button that turns into a progress bar with a elastic effect. Based on a Dribbble shot by xjw. By Lucas Bebber. Article on C
JQuery plugin for creating charts
JQuery Linechart JQuery plugin for building a linechart. Chart ruler completely on HTML/CSS/JS. Bar chart, calendar view visualisation. Diagram, graph
Progressive svg pie, donut, bar and line charts
Peity Peity (sounds like deity) is a jQuery plugin that converts an element's content into a mini svg pie, donut, line or bar chart. Basic Usage HTM
Automatically add a progress bar to your site.
PACE An automatic web page progress bar. Demo Documentation Include pace.js and the theme css of your choice on your page (as early as is possible), a
ProgressJs is a JavaScript and CSS3 library which help developers to create and manage progress bar for every objects on the page.
ProgressJS ProgressJs is a JavaScript and CSS3 library which helps developers create and manage progress bars for every object on the page. How To Use
Material Progress —Google Material Design Progress linear bar. By using CSS3 and vanilla JavaScript.
MProgress.js Google Material Design Progress Linear bar. It uses CSS3 and vanilla JavaScript which doesn't depend on any other libraries. Types and pr
File Upload widget with multiple file selection, drag&drop support, progress bar, validation and preview images, audio and video for jQuery. Supports cross-domain, chunked and resumable file uploads. Works with any server-side platform (Google App Engine, PHP, Python, Ruby on Rails, Java, etc.) that supports standard HTML form file uploads.
jQuery File Upload Contents Description Demo Features Security Setup Requirements Mandatory requirements Optional requirements Cross-domain requiremen
📱📈An elegant, interactive and flexible charting library for mobile.

中文 README F2 is born for mobile, developed for developers as well as designers. It is Html5 Canvas-based, and is also compatible with Node.js, Weex an
nivo provides a rich set of dataviz components, built on top of the awesome d3 and Reactjs libraries

nivo provides supercharged React components to easily build dataviz apps, it's built on top of d3. Several libraries already exist for React d3 integr
A collection of composable React components for building interactive data visualizations

an ecosystem of composable React components for building interactive data visualizations. Victory Contents Getting Started Victory Native API Document
📊 Data visualization library for React based on D3
Data visualization library for React based on D3js REAVIZ is a modular chart component library that leverages React natively for rendering the compone
Composable data visualisation library for web with a data-first approach now powered by WebAssembly
What is Muze? Muze is a free data visualization library for creating exploratory data visualizations (like Tableau) in browser, using WebAssembly. It
Create beautiful JavaScript charts with one line of React
React Chartkick Create beautiful JavaScript charts with one line of React See it in action Supports Chart.js, Google Charts, and Highcharts Quick Star
Financial lightweight charts built with HTML5 canvas
Lightweight Charts Demos | Documentation | Discord community TradingView Lightweight Charts are one of the smallest and fastest financial HTML5 charts
Reusable JavaScript library for creating sketchy/hand-drawn styled charts in the browser.

roughViz.js is a reusable JavaScript library for creating sketchy/hand-drawn styled charts in the browser, based on D3v5, roughjs, and handy. Why? Use
A friendly reusable charts DSL for D3
D4 D4 is a friendly charting DSL for D3. The goal of D4 is to allow developers to quickly build data-driven charts with little knowledge of the intern
Ember Charts 3.5 2.3 L2 JavaScript A powerful and easy to use charting library for Ember.js
Ember Charts A charting library built with the Ember.js and d3.js frameworks. It includes time series, bar, pie, and scatter charts which are easy to
Create beautiful charts with one line of JavaScript
Chartkick.js Create beautiful charts with one line of JavaScript See it in action Supports Chart.js, Google Charts, and Highcharts Also available for
Awesome charts for AngularJS.

n3-line-chart v2 n3-line-chart is an easy-to-use JavaScript library for creating beautiful charts in AngularJS applications and it is built on top of
A plugin for the jQuery javascript library to generate small sparkline charts directly in the browser
jQuery Sparklines This jQuery plugin makes it easy to generate a number of different types of sparklines directly in the browser, using online a line
:dango: An interactive and responsive charting library
English | 简体中文 G2Plot A charting library based on the Grammar of Graphics. G2Plot is an interactive and responsive charting library. Based on the gram
Charts for Raphaël
g.Raphaël - Official charting plugin for Raphaël For more information, see: http://g.raphaeljs.com/ Changelog v0.51 Fixed issues with piechart related
Progressive svg pie, donut, bar and line charts
Peity Peity (sounds like deity) is a jQuery plugin that converts an element's content into a mini svg pie, donut, line or bar chart. Basic Usage HTM
JavaScript toolkit for creating interactive real-time graphs
Rickshaw Rickshaw is a JavaScript toolkit for creating interactive time series graphs, developed at Shutterstock Table of Contents Getting Started Ins
Attractive JavaScript charts for jQuery
flot About flot is a JavaScript plotting library for engineering and scientific applications derived from Flot: http://www.flotcharts.org/ Take a look
JavaScript diagramming library for interactive flowcharts, org charts, design tools, planning tools, visual languages.
GoJS, a JavaScript Library for HTML Diagrams GoJS is a JavaScript and TypeScript library for creating and manipulating diagrams, charts, and graphs. S
📊 A highly interactive data-driven visualization grammar for statistical charts.

English | 简体中文 G2 A highly interactive data-driven visualization grammar for statistical charts. Website • Tutorial Docs • Blog • G2Plot G2 is a visua