109 Repositories
JavaScript chartjs-chart-sankey Libraries
Automatic chart generator from user input using CharGPT.
Chart GPT A platorm for generate chart with ChatGPT 🛠️ ChatGPT Generator is under development. Features Light/dark mode toggle Live previews Fullscre
A server-side-rendered charting library for Fresh
fresh_charts A server side rendered charting library for Fresh based on Chart.js. Usage There are two main ways to render a chart. There is the JSX/TS
Easy-to-use js library for building graphs using svg.
LineChart Easy-to-use js library for building graphs using svg. Examples How to use Just add linechart.js from 'src' directory to your project. And ad
Using ASP.NET Core, SignalR, and ChartJs to create real-time updating charts

Real-time Charts with ASP.NET Core, SignalR, and Chart.js This project shows how to update a real-time chart in your web browser using technologies li
Open source CSS framework for data visualization.
Charts.css Charts.css is an open source CSS framework for data visualization. Visualization help end-users understand data. Charts.css help frontend d
IBM Gantt Chart Component, integrable in Vanilla, jQuery, or React Framework.

@ibm/gantt-chart IBM Gantt Chart Component, integrable in Vanilla, jQuery, or React Framework. Getting started Documentation and Examples are availabl
svgMap is a JavaScript library that lets you easily create an interactable world map comparing customizable data for each country.
svgMap svgMap is a JavaScript library that lets you easily create an interactable world map comparing customizable data for each country. Live demo: h
A jsPlumb-based tree chart implementation for jQuery.
jsPlumbTree A jQuery plugin for generating a tree structure using jsPlumb. The tree is drawn from left to right, top to bottom. Please note that only
A JavaScript library for visualizing Sankey diagrams.
SanKEY.js v1.0.0 last updated: 20.07.2022 Getting started SanKEY.js is a JavaScript data visualization library that provides a simple object-oriented
An easy-to-use cross-framework JS charting library

Compact Chart Visualize your data under a minute, in any Javascript framework Table of Contents About How to use it Examples Demo Plain HTML Example w
TradeX-chart is a trade chart written in plain (vanilla) JavaScript with minimal dependencies

TradeX-chart is a trade chart written in plain (vanilla) JavaScript with minimal dependencies; use it with any framework or backend.
Simple yet flexible JavaScript charting for designers & developers
Simple yet flexible JavaScript charting for designers & developers Documentation All the links point to the new version 3 of the lib. Introduction Get
D3 (or D3.js) is a JavaScript library for visualizing data using web standards
D3 (or D3.js) is a JavaScript library for visualizing data using web standards. D3 helps you bring data to life using SVG, Canvas and HTML. D3 combines powerful visualization and interaction techniques with a data-driven approach to DOM manipulation, giving you the full capabilities of modern browsers and the freedom to design the right visual interface for your data.
Interactive Javascript Chart for Data Visualziations
Forio Contour Interactive Javascript Chart for Data Visualziations Forio Contour provides a core set of common visualizations that you can see in the
A Kubernetes monitoring tool to visualize large-scale activity and real-time comprehensive metrics within your cluster.
Armada A light-weight Kubernetes health monitoring tool. Summary Armada is an open-source tool for monitoring the health of your Kubernetes cluster. I
An open-source visualization library specialized for authoring charts that facilitate data storytelling with a high-level action-driven grammar.

Narrative Chart Introduction Narrative Chart is an open-source visualization library specialized for authoring charts that facilitate data storytellin
Timeline/Graph2D is an interactive visualization chart to visualize data in time.

vis-timeline The Timeline/Graph2D is an interactive visualization chart to visualize data in time. The data items can take place on a single date, or
A Hackable Markdown Note Application for Programmers. Version control, AI completion, mind map, documents encryption, code snippet running, integrated terminal, chart embedding, HTML applets, plug-in, and macro replacement.

Yank Note A hackable markdown note application for programmers Download | Try it Online Not ecommended English | 中文说明 [toc]{level: [2]} Highlights
Typr is a full-stack web application designed for new developers to improve their typing skills. User Authentication, Multiplayer, and Statistics included.

Typr Typr is a full-stack web application designed for new developers to improve their typing skills. It includes Javascript, Ruby and Python typing p
🎧 Get json type billboard hot 100 chart
Billboard json Get json type billboard hot 100 chart, Data update every day !! Url Hot 100 : https://raw.githubusercontent.com/KoreanThinker/billboard
Highly customizable, animated, responsive, and dependency-free Evolution Graph implementation
Highly customizable, animated, responsive, and dependency-free Evolution Graph implementation. The package is built with Vanilla JavaScript and is used to create flexible data visualizations and present evolution relationships between entities.
A React-Fullstack platform helps to track & compare your Incomes & Expenses transactions in one place via detailed Graphical information to manage your Budget.

Budget Master Track your income and expenses in one place via detailed graphical information to manage your budget. Manage your budget and transaction
API to generate candlestick chart data for any time period based on transactions data
candel-maker API to generate candlestick chart data for any time period based on transactions data Installation clone repo git clone https://github.co
A web application to 🔍inspect your GitHub Profile Stats📊 in a lucid way. Visualization made easy with Charts💡🚀

know-your-gitstats A web application to 🔍 inspect your GitHub Profile Stats 📊 in a lucid way. Visualization made easy with Charts 💡 🚀 . ✅ Features
A React-fullstack platform to track all cryptocurrency in one place.

A React-fullstack platform to track all cryptocurrency in one place. Create your account and add your favorite coins.
Lightweight, interactive planning tool that visualizes a series of tasks using an HTML canvas

Planner Lightweight, interactive planning tool that visualizes a series of tasks using an HTML canvas. Try it yourself at plannerjs.dev Plans created
Generate an image of all your Github contributions

GitHub Contribution Chart Generator Generates an image of all your GitHub contributions since you have signed up, so you can use it in social media. T
Synchro Charts is a front-end component library that provides a collection of components to visualize time-series data.
Synchro Charts Synchro Charts is a front-end component library that provides a collection of components to visualize time-series data. You can learn m
Bar Funnel Chart extension for Chart.js

Chart.BarFunnel.js Provides a Bar Funnel Chart for use with Chart.js Documentation To create a Bar Funnel Chart, include Chart.BarFunnel.js after Char
Chart.js Box Plots and Violin Plot Charts

Chart.js Box and Violin Plot Chart.js module for charting box and violin plots. This is a maintained fork of @datavisyn/chartjs-chart-box-and-violin-p
Chart.js Plugin for showing error bars for various chart types

Chart.js Error Bars Chart.js module for charting error bars plots. This plugin extends the several char types (bar, horizontalBar, line, scatter, pola
Chart.js module for charting financial securities
Chart.js Financial Charting Chart.js module for Candlestick and OHLC charts Roadmap Chart.js 2.7.0 added our timeseries scale as new option called dis
Chart.js Choropleth and Bubble Maps
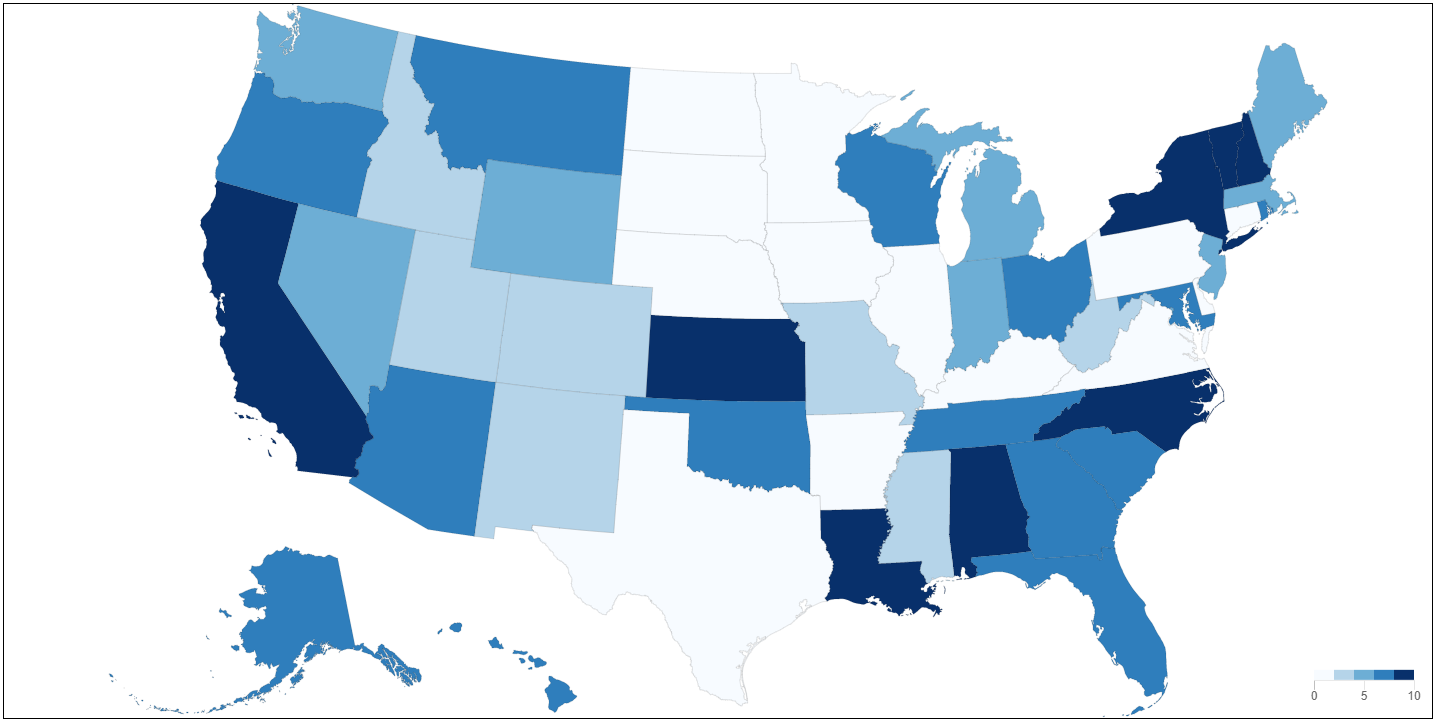
Chart.js Geo Chart.js module for charting maps with legends. Adding new chart types: choropleth and bubbleMap. works great with https://github.com/cha
Chart.js Graph-like Charts (tree, force directed)

Chart.js Graphs Chart.js module for charting graphs. Adding new chart types: graph, forceDirectedGraph, dendogram, and tree. Works great with https://
Chart.js module for creating matrix charts

chartjs-chart-matrix Chart.js v3.0.0 module for creating matrix charts Example Documentation You can find documentation for chartjs-chart-treemap at h
Chart.js Parallel Coordinates Plot
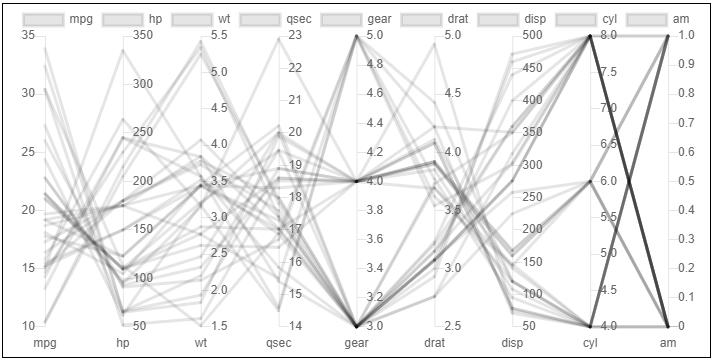
Chart.js Parallel Coordinate Plots Chart.js module for charting parallel coordinate plots (PCPs). Adding new chart type: pcp. Related Plugins Check ou
Chart.js module for creating sankey diagrams

chartjs-chart-sankey Chart.js v3.3.x module for creating sankey diagrams Browser support All modern and up-to-date browsers are supported, including,
Chart.js module for creating treemap charts

chartjs-chart-treemap Chart.js v3.6.0 module for creating treemap charts. Implementation for Chart.js v2 is in 2.x branch Documentation You can find d
Chart.js Venn and Euler Diagrams
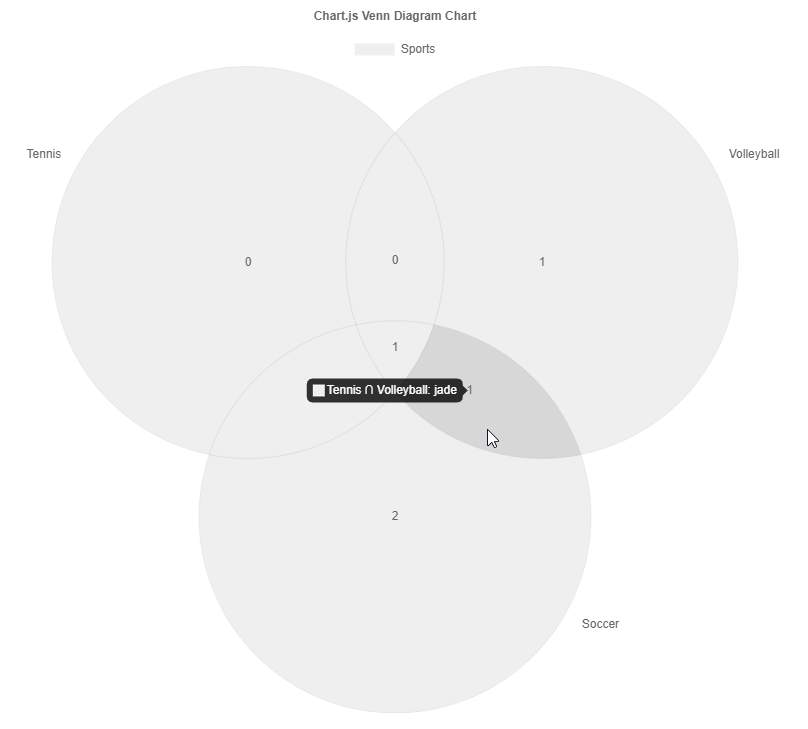
Chart.js Venn and Euler Diagram Chart Chart.js module for charting venn diagrams with up to five sets. Adding new chart type: venn and euler. Related
Chart.js Word Clouds

Chart.js Word Clouds Chart.js module for charting word or tag clouds. Adding new chart type: wordCloud. Related Plugins Check out also my other chart.
Annotation plugin for Chart.js

chartjs-plugin-annotation.js An annotation plugin for Chart.js = 3.0.0 This plugin needs to be registered. It does not function as inline plugin. For
Automatic color generation for Chart.js

chartjs-plugin-autocolors Automatic color generation for Chart.js The generation is based on Janus Troelsen's answer at Stack Overflow. This plugin re
Predefined color schemes for Chart.js
chartjs-plugin-colorschemes Predefined color schemes for Chart.js You can pick the perfect color combination for your charts from the predefined color
Crosshair plugin for ChartJS

Chart.js plugin to draw vertical crosshair, zoom, interpolate values and sync chart interactions. Requires Chart.js 3.4.0 or later. Documentation Inst
Chart.js plugin to display labels on data elements
Overview Highly customizable Chart.js plugin that displays labels on data for any type of charts. Requires Chart.js 3.x. Documentation Introduction Ge
Chart.js plugin for Prometheus data loading

Welcome to chartjs-plugin-datasource-prometheus 👋 A Prometheus datasource for ChartJS. Dependencies: requires chart.js 2.7 or later. requires moment.
Chart.js plugin to defer initial chart updates

Chart.js plugin to defer initial chart updates until the user scrolls and the canvas appears inside the viewport, and thus trigger the initial chart a
Draggable data points plugin for Chart.js

chartjs-plugin-dragdata.js Now compatible with Chart.js v3 🎉 Looking for a version compatible to Chart.js 2.9.x? Then visit the v2 branch! A plugin
Easy gradients for Chart.js

chartjs-plugin-gradient Easy gradients for Chart.js This plugin requires Chart.js 3.0.0 or later. Could work with v2, but it is not supported. NOTE th
Chart.js scale for hierarchical tree-like data structure
Chart.js Hierarchical Scale Plugin Chart.js module for adding a new categorical scale which mimics a hierarchical tree. Related Plugins Check out also
Chart.js plugin to calculate and draw statistical linear, exponential, power, logarithmic, and polynomial regressions.
chartjs-plugin-regression Chart.js plugin to calculate and draw statistical linear, exponential, power, logarithmic, and polynomial regressions using
Chart.js plugin to create charts with a hand-drawn, sketchy, appearance
chartjs-plugin-rough Chart.js plugin to create charts with a hand-drawn, sketchy, appearance Version 0.2 requires Chart.js 2.7.0 or later, and Rough.j
This plugin for Chart.js that makes your bar chart to 100% stacked bar chart.

chartjs-plugin-stacked100 This plugin for Chart.js that makes your bar chart to 100% stacked bar chart. Requires Chart.js 3.x. Demo: https://y-takey.g
Chart.js plugin for live streaming data
chartjs-plugin-streaming Chart.js plugin for live streaming data chartjs-plugin-streaming 2.x requires Chart.js 3.0.0 or later. If you need Chart.js 2
Chart.js plugin for more styling options
chartjs-plugin-style Chart.js plugin for more styling options This plugin requires Chart.js 2.6.0 or later. Installation You can download the latest v
Makes waterfall charts easy with chartjs-2
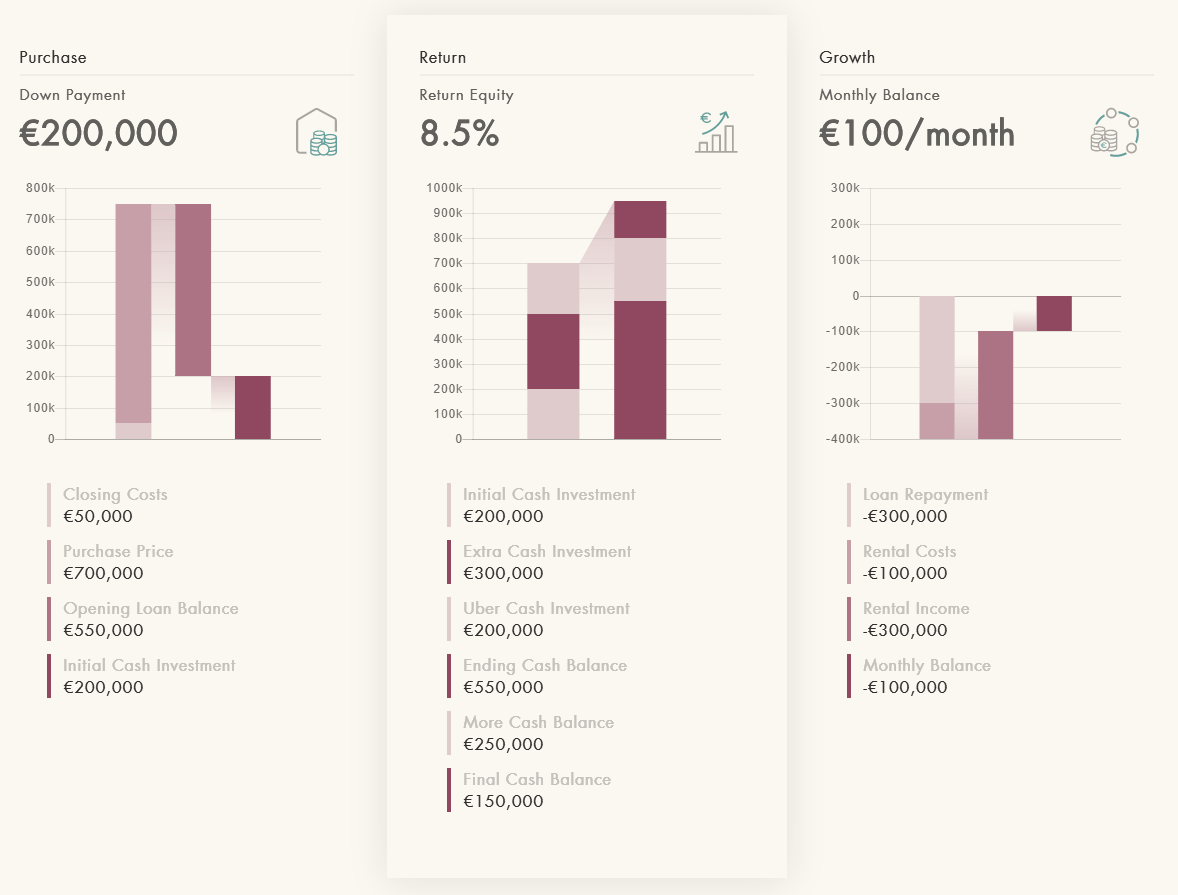
Installation npm install --save chartjs-plugin-waterfall Here's what it looks like: Usage Just import the plugin and add it to any chart that you want
Zoom and pan plugin for Chart.js
chartjs-plugin-zoom A zoom and pan plugin for Chart.js = 3.0.0 For Chart.js 2.6.0 to 2.9.x support, use version 0.7.7 of this plugin. Panning can be
date-fns adapter for Chart.js
chartjs-adapter-date-fns Overview This adapter allows the use of date-fns with Chart.js. Requires Chart.js 2.8.0 or later and date-fns 2.0.0 or later.
Luxon adapter for Chart.js
chartjs-adapter-luxon Overview This adapter allows the use of Luxon with Chart.js. Luxon provides built-in support for time zones and internationaliza
This adapter allows the use of Moment.js with Chart.js
chartjs-adapter-moment Overview This adapter allows the use of Moment.js with Chart.js. Moment.js is a very heavy library and thus not recommended for
A simple ember component for adding Charts
Ember Chart This Ember CLI addon is a simple wrapper for ChartJS (v2.9). Compatibility Ember.js v3.12 or above Ember CLI v2.13 or above Node.js v10 or
Simple yet flexible charting Lightning Web Component using Chart.js for admins & developers
Lightning Web Chart.js Component Simple yet flexible charting Lightning Web Component using Chart.js for admins & developers Documentation Getting sta
Beautiful charts for Angular based on Chart.js
ng2-charts slack Beautiful charts for Angular based on Chart.js Usage & Demo Samples using ng2-charts https://valor-software.com/ng2-charts/ Installat
React components for Chart.js, the most popular charting library
react-chartjs-2 React components for Chart.js, the most popular charting library. Supports Chart.js v3 and v2. Quickstart • Docs • Slack • Stack Overf
📊 Vue.js wrapper for Chart.js

vue-chartjs vue-chartjs is a wrapper for Chart.js in vue. You can easily create reuseable chart components. Demo & Docs 📺 Demo 📖 Docs Compatibility
J2CL and GWT Charts library based on CHART.JS

Charba - J2CL and GWT Charts library based on CHART.JS What's Charba GWT Web toolkit doesn't have charting library available out of the box. There are
Java library for use with Chart.js javascript library
Chart.java Chart.java enables integration with the excellent Chart.js library from within a Java application. Usage example In Java: BarDataset datase
Chart.js bindings for OCaml
chartjs-ocaml: OCaml bindings for Chart.js This library provides OCaml bindings for the Chart.js charting library and some popular plugins. Following
Django Class Based Views to generate Ajax charts js parameters.
Django Chartjs Django Chartjs lets you manage charts in your Django application. This is compatible with Chart.js and Highcharts JS libraries. Using a
The power of Chart.js in Jupyter !

The power of Chart.js in Jupyter Notebooks Installation You can install ipychart from your terminal using pip or conda: # using pip $ pip install ipyc
Simple package to facilitate and automate the use of charts in Laravel 5.x using Chartjs v2 library
laravel-chartjs - Chart.js v2 wrapper for Laravel 5.x Simple package to facilitate and automate the use of charts in Laravel 5.x using the Chart.js v2
A Simple Dashboard Chart in Laravel Nova using Chart JS
A Simple Dashboard Chart in Laravel Nova using Chart JS. Starting create your own dashboard with Chart JS Integration can save your time and help you maintain consistency across standard elements such as Bar, Stacked, Line, Area, Doughnut and Pie Chart.
Extend GitHub pages with support for LaTeX, plotly, etc.
Extend GitHub pages with support for LaTeX, plotly, etc. xhub is a browser extension for Google Chrome that lets you use various add-ons on GitHub REA
🍞📊 Beautiful chart for data visualization.

🍞 📈 Spread your data on TOAST UI Chart. TOAST UI Chart is Beautiful Statistical Data Visualization library. 📦 Packages The functionality of TOAST U
TChart.js - simple and configurable Bar and Line Chart library in Javascript

TChart.js Simple and configurable Bar and Line Chart library in Javascript Description TChart.js is a canvas-based simple Javascript Bar and Line Char
Worldwide-covid-statistics - covid-19 tracker developed using Reactjs, Axios , chartjs, material icons
Getting Started with Create React App This project was bootstrapped with Create React App. Available Scripts In the project directory, you can run: np
A simple interactive web page for your Gantt Chart (build with Vue.js)

Web Gantt A simple interactive web page for your Gantt Chart (build with Vue.js) No dependency required, no command line, just download the repo and l
Personal blog and portfolio with a admin panel and comment system.
Implementation of a Full Stack Blog With a Comment System And Admin Panel With PHP, React & MYSQL FULL DOCUMENTATION SITE LINK Contents Database Desig
JQuery plugin for creating charts
JQuery Linechart JQuery plugin for building a linechart. Chart ruler completely on HTML/CSS/JS. Bar chart, calendar view visualisation. Diagram, graph
📈 A small, fast chart for time series, lines, areas, ohlc & bars

📈 μPlot A small (~35 KB min), fast chart for time series, lines, areas, ohlc & bars (MIT Licensed) Introduction μPlot is a fast, memory-efficient Can
Smoothie Charts: smooooooth JavaScript charts for realtime streaming data
Smoothie Charts is a really small charting library designed for live streaming data. I built it to reduce the headaches I was getting from watching ch
Chart image and QR code web API
QuickChart QuickChart is a service that generates images of charts from a URL. Because these charts are simple images, they are very easy to embed in
Create beautiful JavaScript charts with one line of Ruby
Chartkick Create beautiful JavaScript charts with one line of Ruby. No more fighting with charting libraries! See it in action Chartkick 4.0 was recen
JQuery plugin for creating charts
JQuery Linechart JQuery plugin for building a linechart. Chart ruler completely on HTML/CSS/JS. Bar chart, calendar view visualisation. Diagram, graph
Progressive svg pie, donut, bar and line charts
Peity Peity (sounds like deity) is a jQuery plugin that converts an element's content into a mini svg pie, donut, line or bar chart. Basic Usage HTM
🍞📝 Markdown WYSIWYG Editor. GFM Standard + Chart & UML Extensible.
TOAST UI Editor v3 major update planning 🏃 🏃 🏃 TOAST UI Editor is planning a v3 major update for 2021. You can see our detail RoadMap here! GFM Mar
JavaScript library for HTML5 & CSS3 time sheets
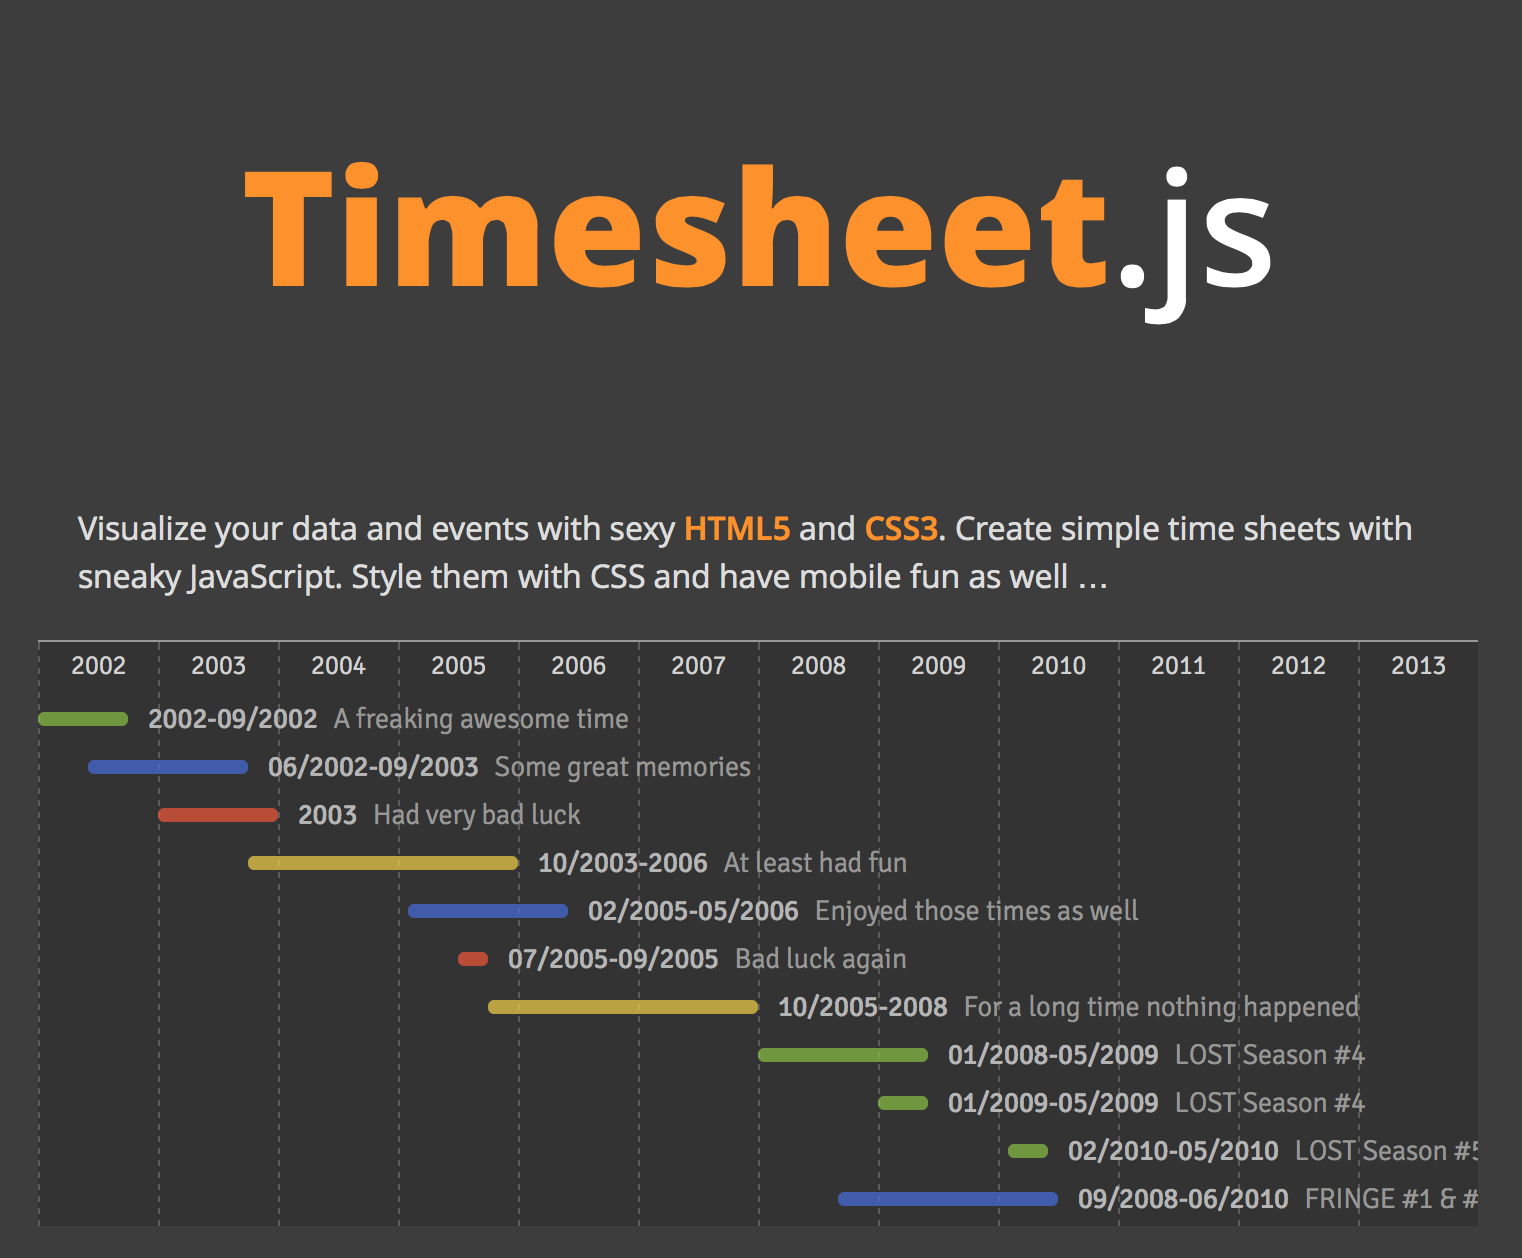
Timesheet.js Simple JavaScript library to create HTML time sheets. Wrapped in an example project using Middleman … You only have to include dist/times
Luckysheet is an online spreadsheet like excel that is powerful, simple to configure, and completely open source.
English| 简体中文 Introduction 🚀 Luckysheet is an online spreadsheet like excel that is powerful, simple to configure, and completely open source. Links
Data Visualization Components

react-vis | Demos | Docs A COMPOSABLE VISUALIZATION SYSTEM Overview A collection of react components to render common data visualization charts, such
🐯 visx | visualization components

visx visx is a collection of reusable low-level visualization components. visx combines the power of d3 to generate your visualization with the benefi
Redefined chart library built with React and D3
Recharts Introduction Recharts is a Redefined chart library built with React and D3. The main purpose of this library is to help you to write charts i
📊 Data visualization library for React based on D3
Data visualization library for React based on D3js REAVIZ is a modular chart component library that leverages React natively for rendering the compone
Composable data visualisation library for web with a data-first approach now powered by WebAssembly
What is Muze? Muze is a free data visualization library for creating exploratory data visualizations (like Tableau) in browser, using WebAssembly. It
:bar_chart: A library of modular chart components built on D3
Plottable Plottable is a library of chart components for creating flexible, custom charts for websites. It is built on top of D3.js and provides highe
:bar_chart: Declarative Charting Framework for Angular
ngx-charts Declarative Charting Framework for Angular! ngx-charts is unique because we don't merely wrap d3, nor any other chart engine for that matte
:bar_chart: Re-usable, easy interface JavaScript chart library based on D3.js
billboard.js is a re-usable, easy interface JavaScript chart library, based on D3 v4+. The name "billboard" comes from the famous billboard chart whic
🍞📊 Beautiful chart for data visualization.
🍞 📈 Spread your data on TOAST UI Chart. TOAST UI Chart is Beautiful Statistical Data Visualization library. 📦 Packages The functionality of TOAST U
Powerful data visualization library based on G2 and React.

BizCharts New charting and visualization library has been released: http://bizcharts.net/products/bizCharts. More details about BizCharts Features Rea
GPL version of Javascript Gantt Chart
dhtmlxGantt Getting started | Features | Follow us | License | Useful links dhtmlxGantt is an open source JavaScript Gantt chart that helps you illust